SPC Case Study: Cement Industry

Learn how a cement company used SPC to reduce defects from 32% to less than 1%
Data is a powerful tool. It can distinguish a functional process from a non-functional one. Data analysis is widely used in businesses because we are constantly flooded with information, and need to make quick decisions. However, when the volume of data becomes massive, interpreting it can become difficult. Are we facing issues with our data? Is one outlier too few or too many?
For example, is the chart below a consistent or inconsistent data set?
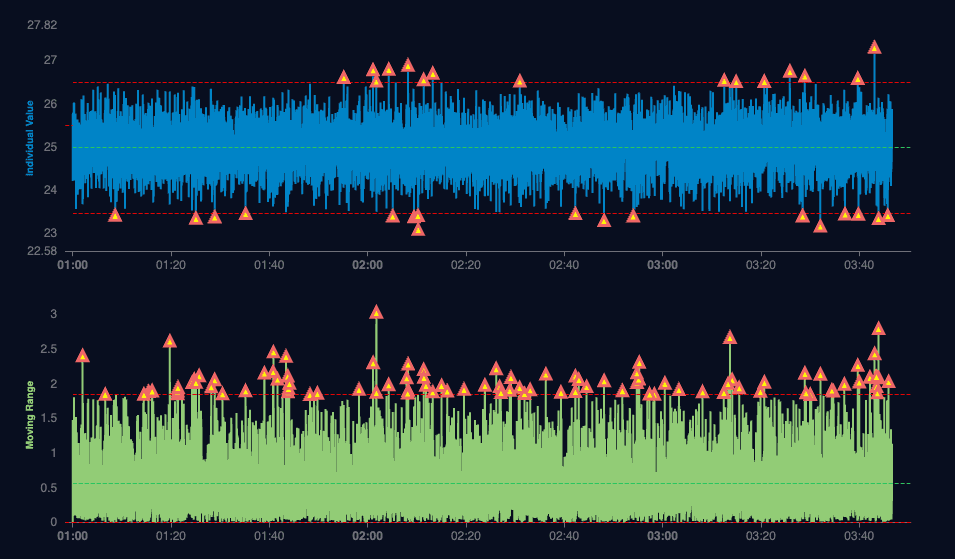
Some of our readers may find it impractical to analyze every individual measurement because we lack the personnel or resources. In other cases, the variability across a surface from one point to the next may be so small that it doesn't make sense to record so many measurements. Tracking every single measurement in high-speed environments can also be difficult.
This is where the X-bar R chart comes in. While the I-MR chart is ideal for individual measurements, the X-bar R chart focuses not on the small variations but on variations between subgroups of data.
A subgroup of data of data is a collection of data points grouped together. In many cases, because the variability from sample to sample is so small, it makes sense to "group" the data instead of recording individual readings. For example, you might take 5 measurements every hour, and instead of analyzing them individually, you calculate the average of these 5. This helps prevent overloading the data set with unnecessary information, making it easier to make decisions.
Our Case Study - The Cement Industry
The company behind this implementation has been in operation since 1927 and is one of the oldest in the world. In 2017, they faced an issue where 32% of their bag production was out of specification in two areas: bag length and valve width.
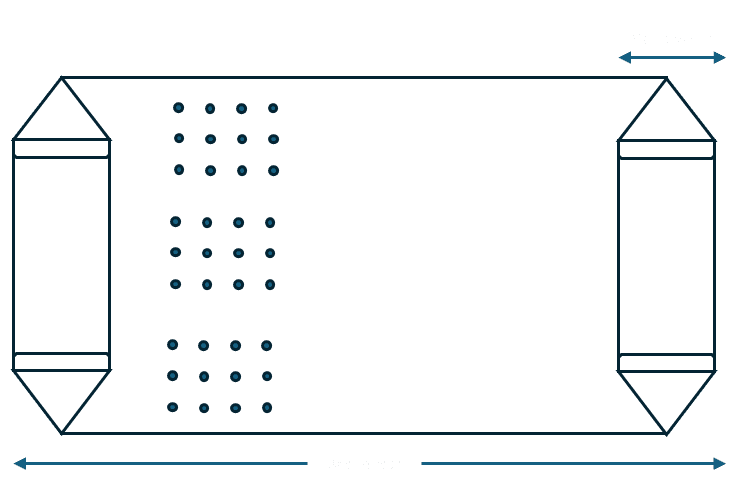
Having these values outside of specification causes the company to lose money, because of either improperly packed products, or the need to reprocess defects. The average loss the company was facing was USD 330 per batch.
The company recently had an increase in their production volumes which led to the need to open new lines, which of course inherited this problem.
To resolve the issue, the company was left with two options:
- Invest in new technologies in their production lines, which would cost 3.5 million USD. However, this option did not guarantee a solution and was not approved for budgetary reasons.
- Use SPC techniques to monitor bag production, and use this to correct issues in their process.
The study was launched in April 2017 and ran through April, May, June, and July. The company decided that due to the volume they handled it made sense to measure subgroups of 4 bags. The company operates in two shifts, and samples were taken for 25 days each month. They had four production lines. The requirement agreed with customers for bag length is 60 cm, and for valve width, it is 9.5 cm, with a tolerance in both cases of +/- 0.2 cm.
What did the data show?
Management was confused: The average results showed bag length was on average 59,8 cm (inside of spec), and valve width was, on average 9,49 cm(also inside of specification).
Then, why do we say this is a problem? Going with the average only is a common mistake. Many times we tend to look only at the center of our data and ignore the spread. The center is a good indication of where most of our data will be located, but it fails at accurately measuring consistency.
A Process Capability Analysis was then carried out to understand how good was the process when compared to the specifications promised to the customers. The expectation was a Cpk > 1,33.
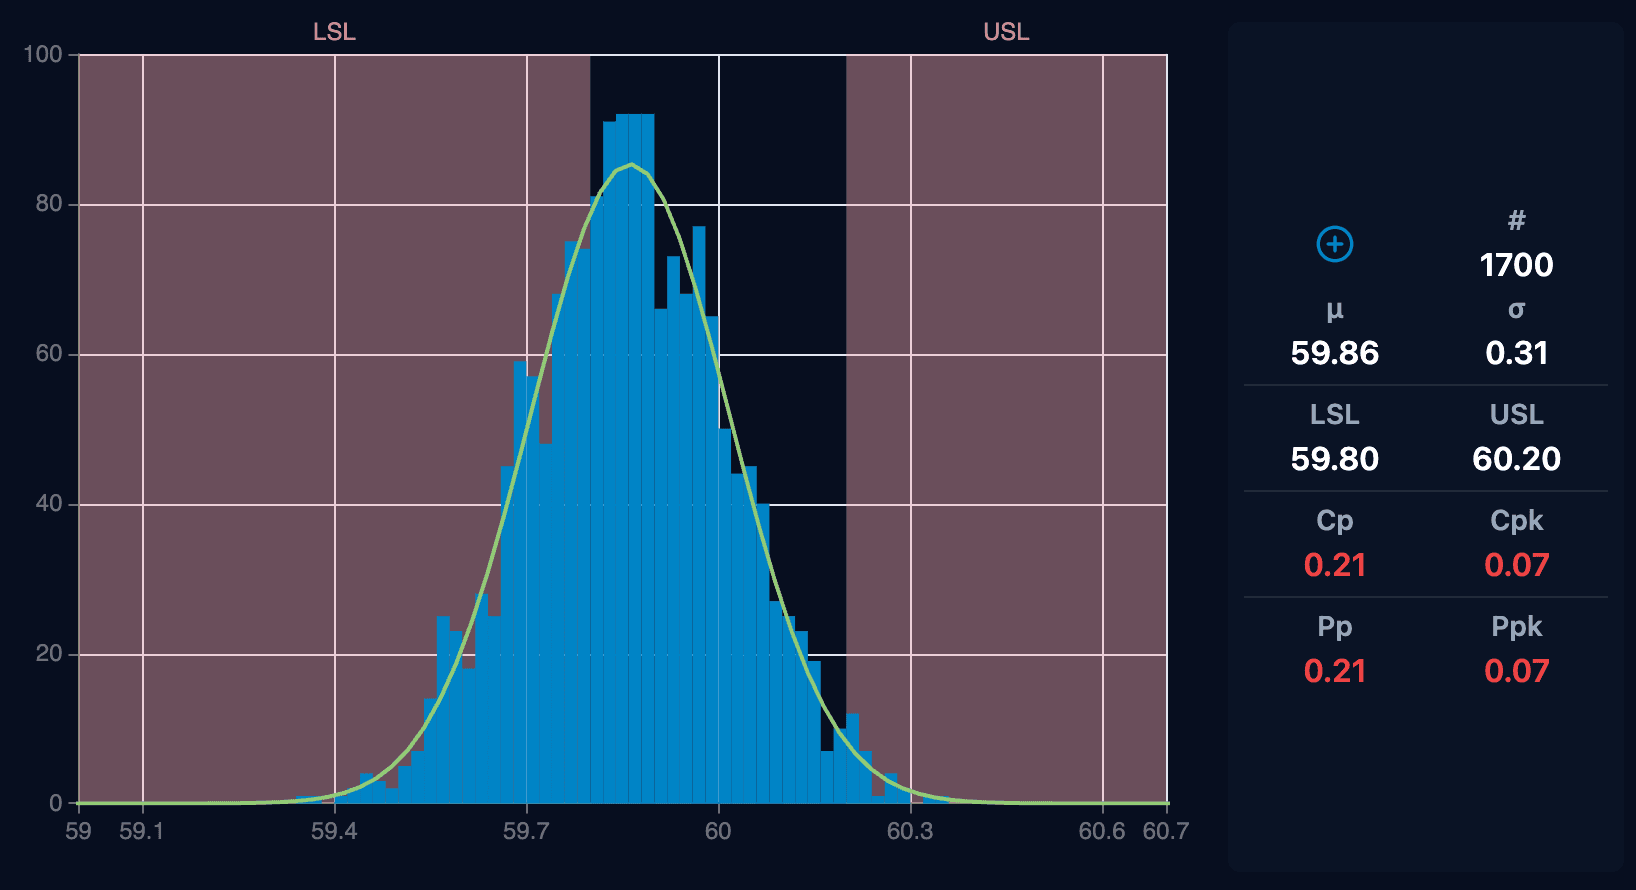
Bag Length Capability Analysis
When the cement bags were evaluated for quality, the result showed most data points were shifted to the left of the mean. The variability was so big some values of the population would also fall outside of the Upper Specification Limit. This produced a Cpk Value of 0,07.
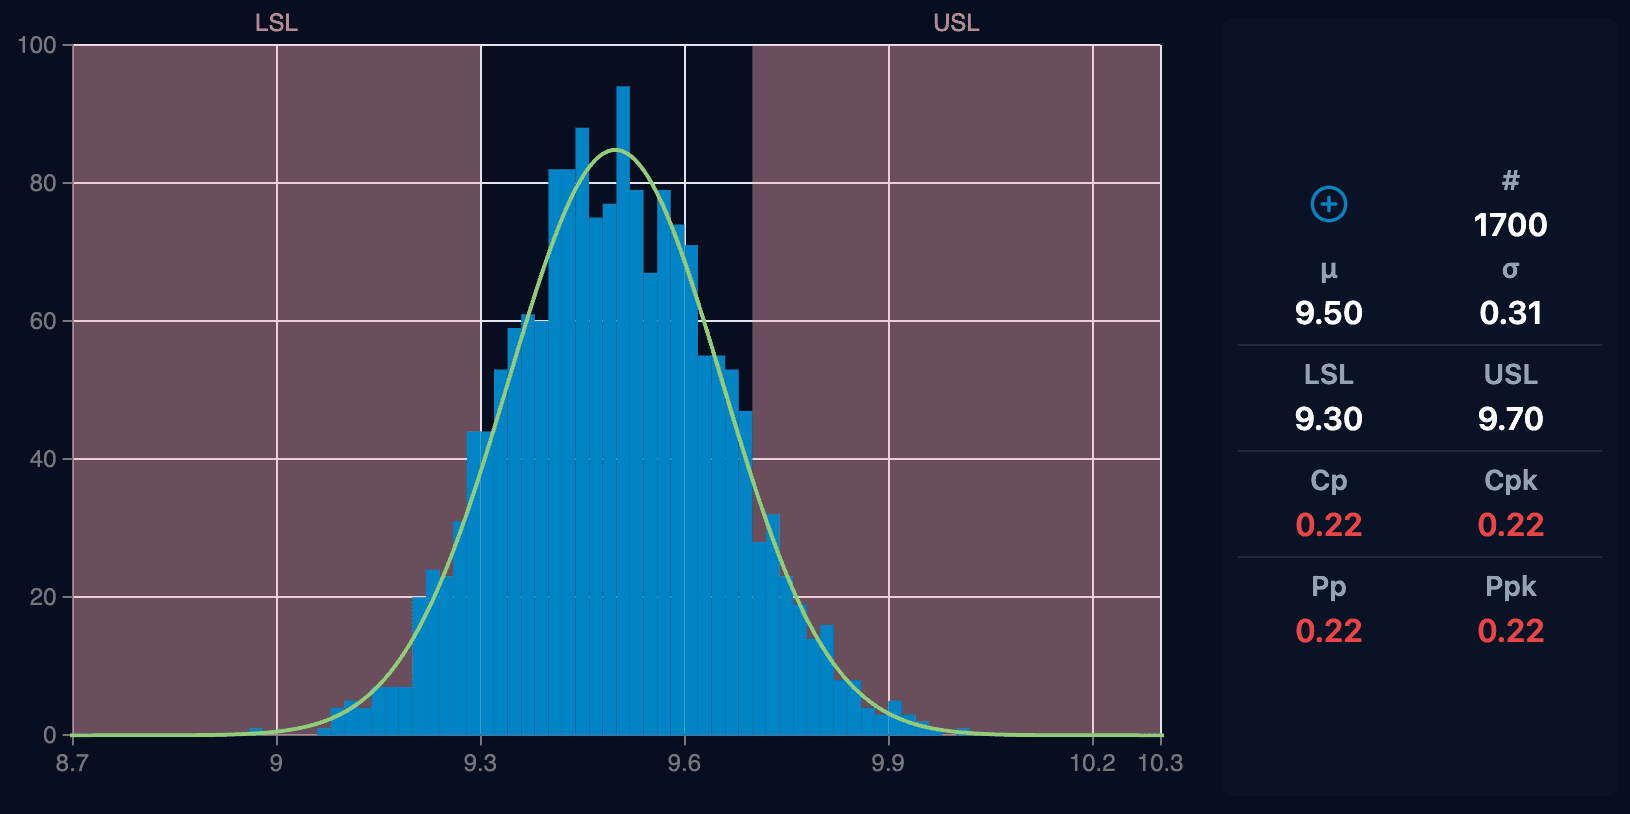
Valve Width Upper
Valve Width Lower
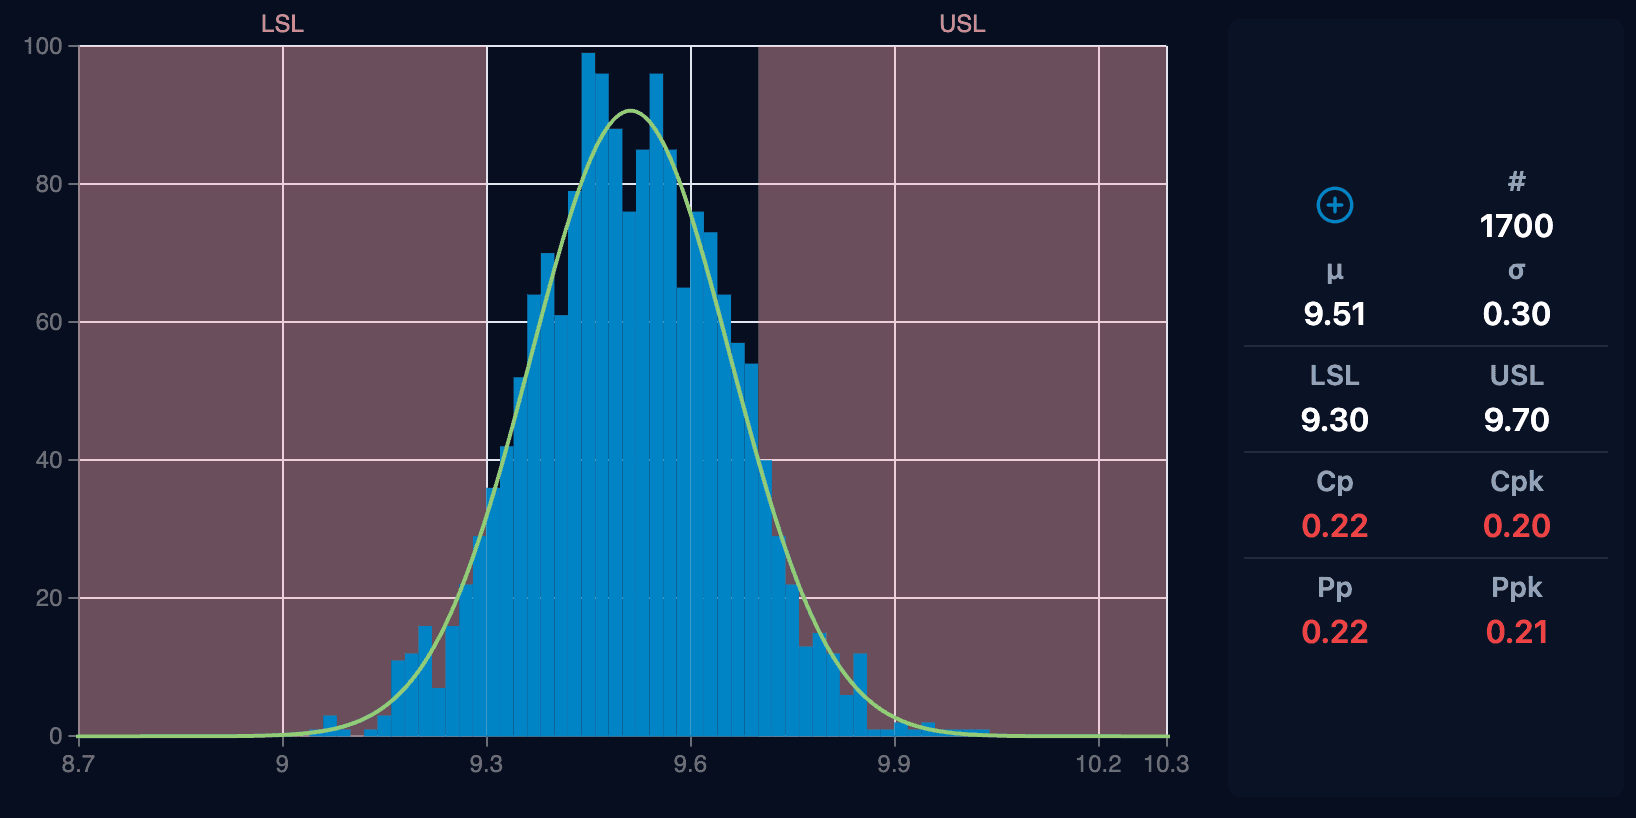
When it came to evaluating the valve widths, the mean was much better at being centered, but then again, the process was too variable. This produced values for Cpk in the Upper valve of 0,22 and in the lower valve of 0,20.
The company understood it was not enough to be on "average". They decided to tackle the inconsistencies as well.
What did the company do?
The company found several deficiencies in the process. They decided to pull up their sleeves and start to work on identifying signals of problems:
1. Have the staff become familiar with the SPC techniques
At the beginning of any process, people can be afraid of making mistakes. When they see the math behind SPC, many can think "This will take us years to achieve", and this is what they decided was going to be their first step - get people comfortable.
SPC is never about making things very difficult. It actually aims for the opposite, it makes it easy to visualize where your weaknesses are. Making sure people understand how to interpret their information, including how to escalate when Outliers happen was the first step.
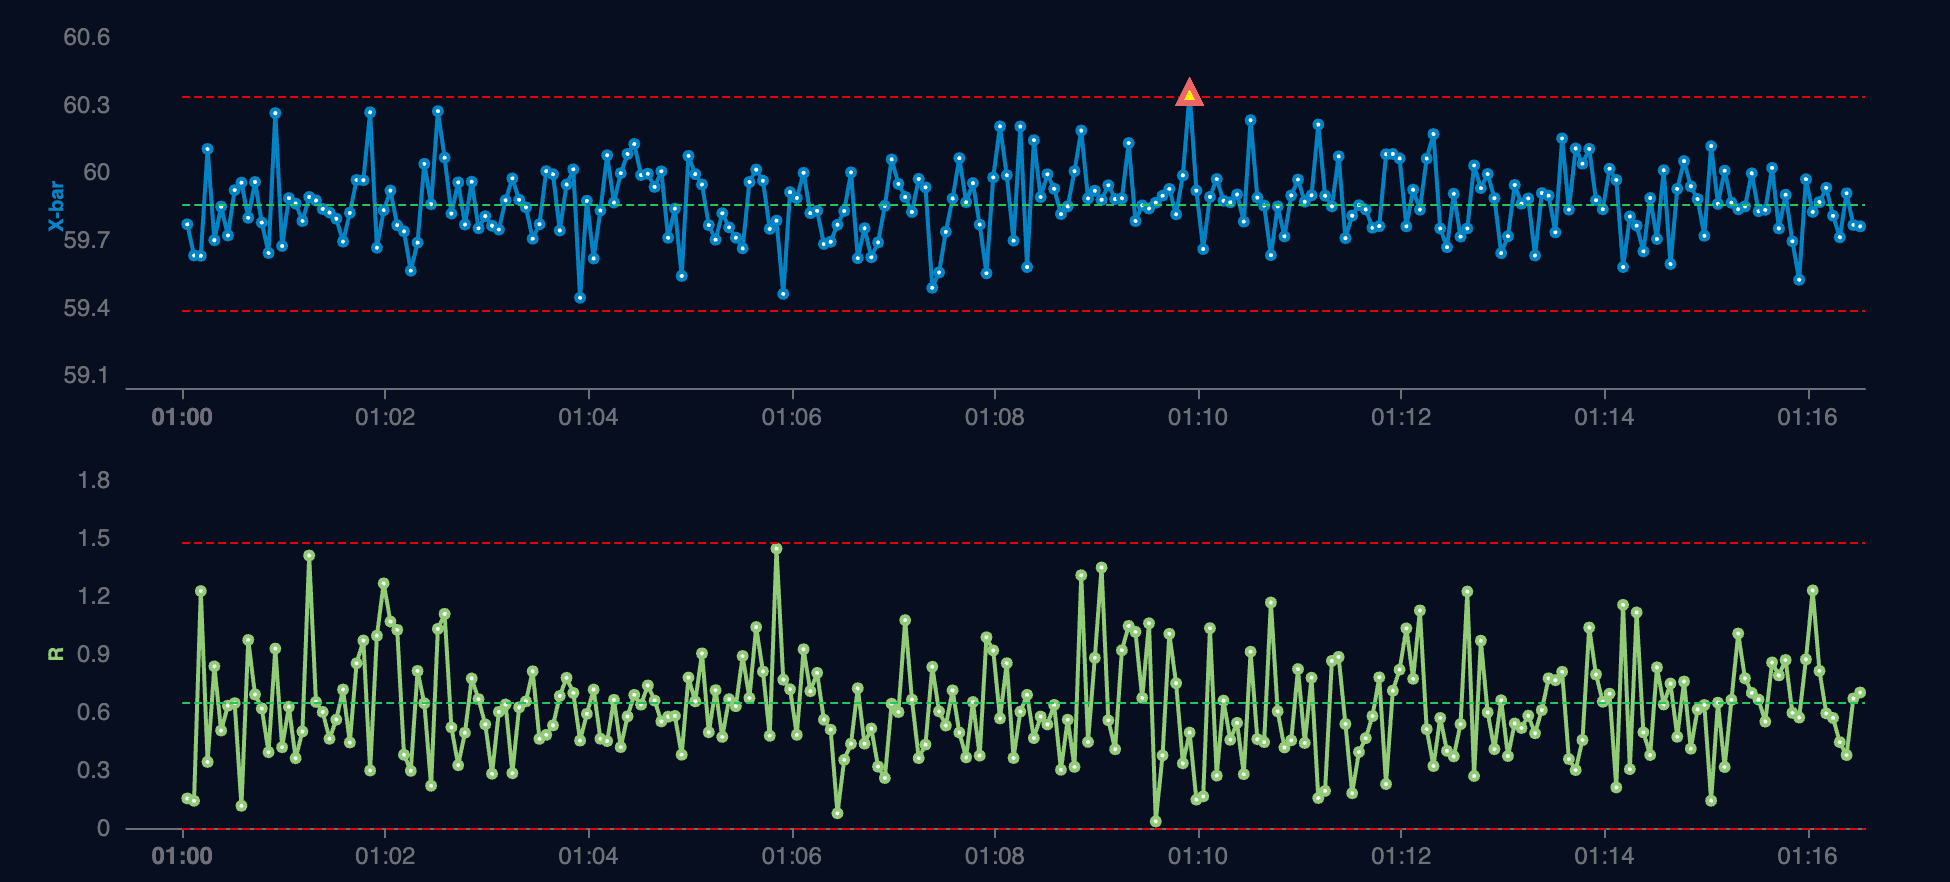
2. Investigating the Outliers
Collecting this data made it clear that some of their machines weren't being maintained regularly. Whenever an issue arose, the maintenance teams would address it, but over time, these problems would resurface. This was something they only began to understand after they started tracking data.
Another challenge was that outliers often appeared when working with specific suppliers, pointing to deficiencies in the quality of the materials themselves.
Identifying these issues made it easier for them to make key decisions: Which suppliers perform better? How long does it take for a machine to become unstable? What can the operator do to prevent these issues?
3. Correcting the Systemic Causes
By addressing these insights, they were able to establish a rigorous Preventative Maintenance schedule. This ensured that machines were serviced before they reached their failure points. Having this planned downtime proved to be a game changer, allowing them to save money and operate much more efficiently, with fewer emergency maintenance calls.

The company also implemented an autonomous maintenance check at the start of every shift. These simple tasks allowed operators to quickly assess whether their machines were in good condition before starting work. While some might think, "I'm not a mechanic," it's similar to checking your car. You don't need to be a mechanic to notice when something isn't working.

What happened next?
The results were nothing short of remarkable. By implementing these actions, the company reduced defects from a staggering 32% to less than 1%. Since then, SPC has become a cornerstone of their operations. It's no longer seen as just another step in the process but as an essential tool that empowers them to swiftly adapt and respond to any changes, ensuring continuous improvement and efficiency.
I'm David, Lean Six Sigma Master Black Belt
With over 15 years of experience in various manufacturing industries, I've gained valuable knowledge and insights. I'm happy to help with any questions or comments you might have about this post or statistics in general—feel free to reach out!

I'm David, Lean Six Sigma Master Black Belt

With over 15 years of experience in various manufacturing industries, I've gained valuable knowledge and insights. I'm happy to help with any questions or comments you might have about this post or statistics in general—feel free to reach out!